Why Can a Crypto Network Hit Record Use While Its Price Keeps Falling?
Ethereum set record usage while its price slid and Tether overtook it by market cap. Price is set by the marginal buyer and flows, not network activity.
By the Deriv desk · 26 June 2026 · 4 min read

Price is set at the margin by who is buying and selling right now, not by how busy the network is. Ethereum just proved it. The chain printed record transactions and wallet counts while its price slid and Tether quietly overtook it by market cap.
How busy a network is and what its coin costs are two different things
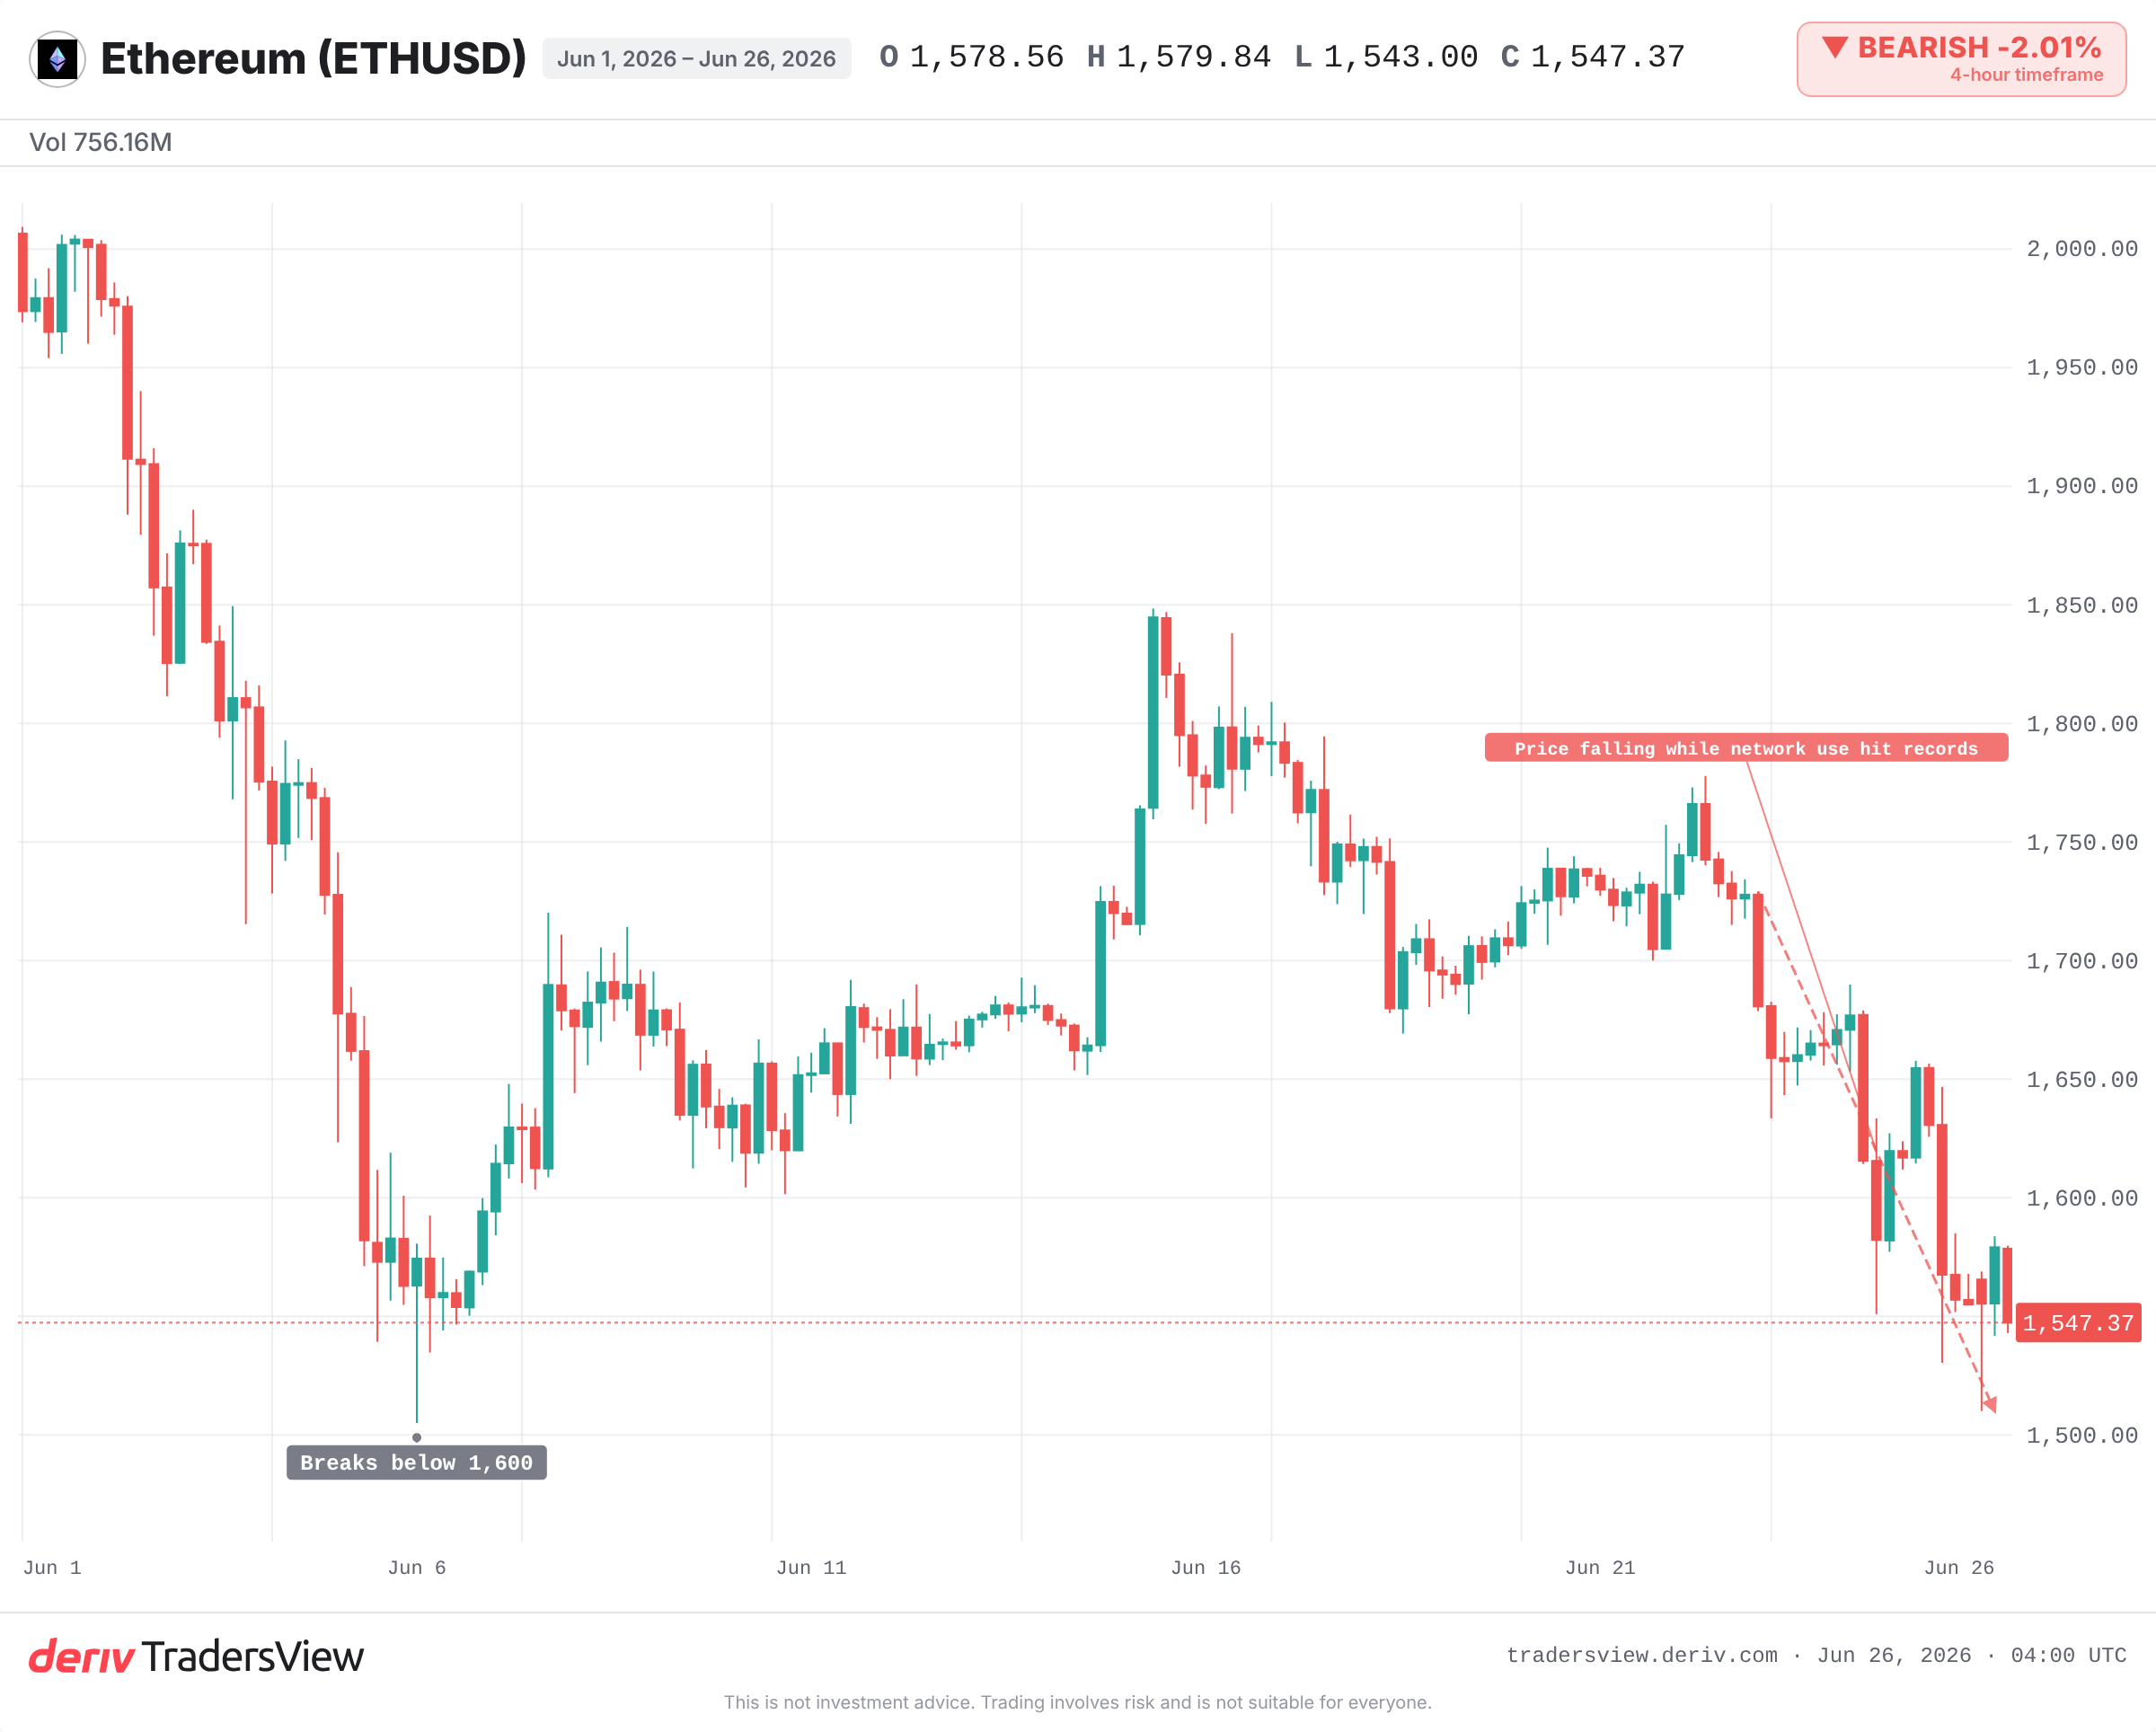
A blockchain can run hotter than ever and still see its token fall. Ethereum hit all-time highs in daily transactions, wallet numbers and value locked in DeFi. Over the same stretch its price dropped, down more than 30% on the year.
Usage tells you how much the network is used. Price tells you what the last buyer was willing to pay. Those are not the same thing, and they can drift apart for months.
Why the marginal buyer sets the price
Price moves on flows, the money actually changing hands at the edge. When that flow dries up, price falls even if a billion wallets stay active.
Right now the flow is leaving. Ethereum's spot ETFs saw four straight days of roughly $82 million in outflows. Open interest on Binance sat at three-month lows. Less new money, less leverage, weaker risk appetite. The marginal buyer stepped back, so the bid thinned, and price followed.
None of that shows up in a transaction count. A network can clear record volume while the people who set the price simply walk away.
What the Tether flippening actually measures
Tether's USDT briefly passed Ethereum by market cap. That sounds like a verdict on Ethereum. It is closer to a thermometer for fear.
Stablecoins now sit near 15% of the total crypto market. When traders sell volatile coins and park cash in stablecoins, stablecoin share rises. A rising stablecoin cap usually means money is hiding, not that the chain underneath is broken.
The same pattern showed up in 2022. After Terra and FTX collapsed, traders rotated into USDT and USDC, and stablecoin dominance climbed. That risk-off rush marked a capitulation that came before the late-2022 bottom, not after a recovery.
Why the gap can close either way
Here is the honest part: strong on-chain activity does not promise a bounce. The 2018 bear market is the warning. Ethereum's usage and developer activity kept growing while price fell from over $1,400 to under $100, and it stayed there for more than a year before flows returned in 2020.
There is a bullish read too. Exchange reserves fell by 475,000 ETH, meaning coins left exchanges. Whales and large buyers like BitMine kept accumulating. Coins leaving exchanges and heavy network use have preceded past recoveries.
The deciding factor is flows, not fundamentals. For the bullish case, ETF outflows need to stall and reverse and open interest needs to rebuild. If outflows keep compounding, the same record usage can sit next to a price that grinds lower.
What to watch
- ETF flows: a flip from outflows to sustained inflows is the clearest sign the marginal buyer is back.
- Open interest: a rebuild off three-month lows signals returning conviction and leverage.
- Stablecoin dominance: falling back from near 15% suggests cash rotating into majors; rising further means more hiding.
- Exchange reserves: a continued decline keeps supply off the market; a reversal means coins moving back to sell.
On-chain green and price red can coexist for a long time. The evidence leans toward flows leading the way out, so watch the money entering and leaving before reading too much into the activity charts. Crypto stays volatile, and either side of this can extend further than feels reasonable.
Frequently asked questions
It refers to Tether's USDT market cap briefly rising above Ethereum's. It reflects traders rotating into stablecoins during risk-off periods rather than a failure of the Ethereum network itself.
They remove a source of buying demand. When ETFs see sustained outflows, fewer dollars flow into the asset at the margin, which weakens the bid and can pressure price even when network usage is strong.
Falling reserves mean coins are leaving exchanges, often into longer-term storage, which reduces immediate sell-side supply. Rising reserves can signal coins moving back to exchanges to sell.
Not on its own. Value locked measures network activity, while price depends on flows and positioning. The two can diverge for months, as Ethereum's recent record usage alongside falling price shows.